Fun with Stats - Tracking Sleep & Mood with Twilio and Webtask
Dec 27th, 2023 update: Webtasks have been deprecated.
This is a small project I’ve been working on for a while to track sleep and mood. It is pretty obvious from our own personal experience how important sleep is. And that bad sleep patterns lead to a pretty poor general wellbeing and mood.
Building on the experience of creating the Marcus Aurelius daily quote app I described on my previous post, I decided to use SMS as the main interaction method. Why? because it is so simple:
- No apps to install / update
- Works on any phone
- Universally available
Architecture
The solution follows the same design I used for Marcus’ quotes. It consists of:
- A Twilio “app” that receives SMS requests and calls an API to store events.
- A database where events are stored.
- An API to query the database and create new events.
- A simple webpage that shows a few graphs with historical and statistical data.
The last piece was a lot of fun to build. Had to refresh my college statistics knowledge I had not used recently. Good thing my son Agustin is currently studying linear regressions, so he helped me out test some of my datasets.
Once again, the database is an mlab free tier database. I’m actually reusing the same I used for Marcus’ quotes. Different collection.
The API, the Twilio app and the webpage are Webtask based systems (the same webtask actually, with different endpoints). And of course, everything is secured with Auth0.
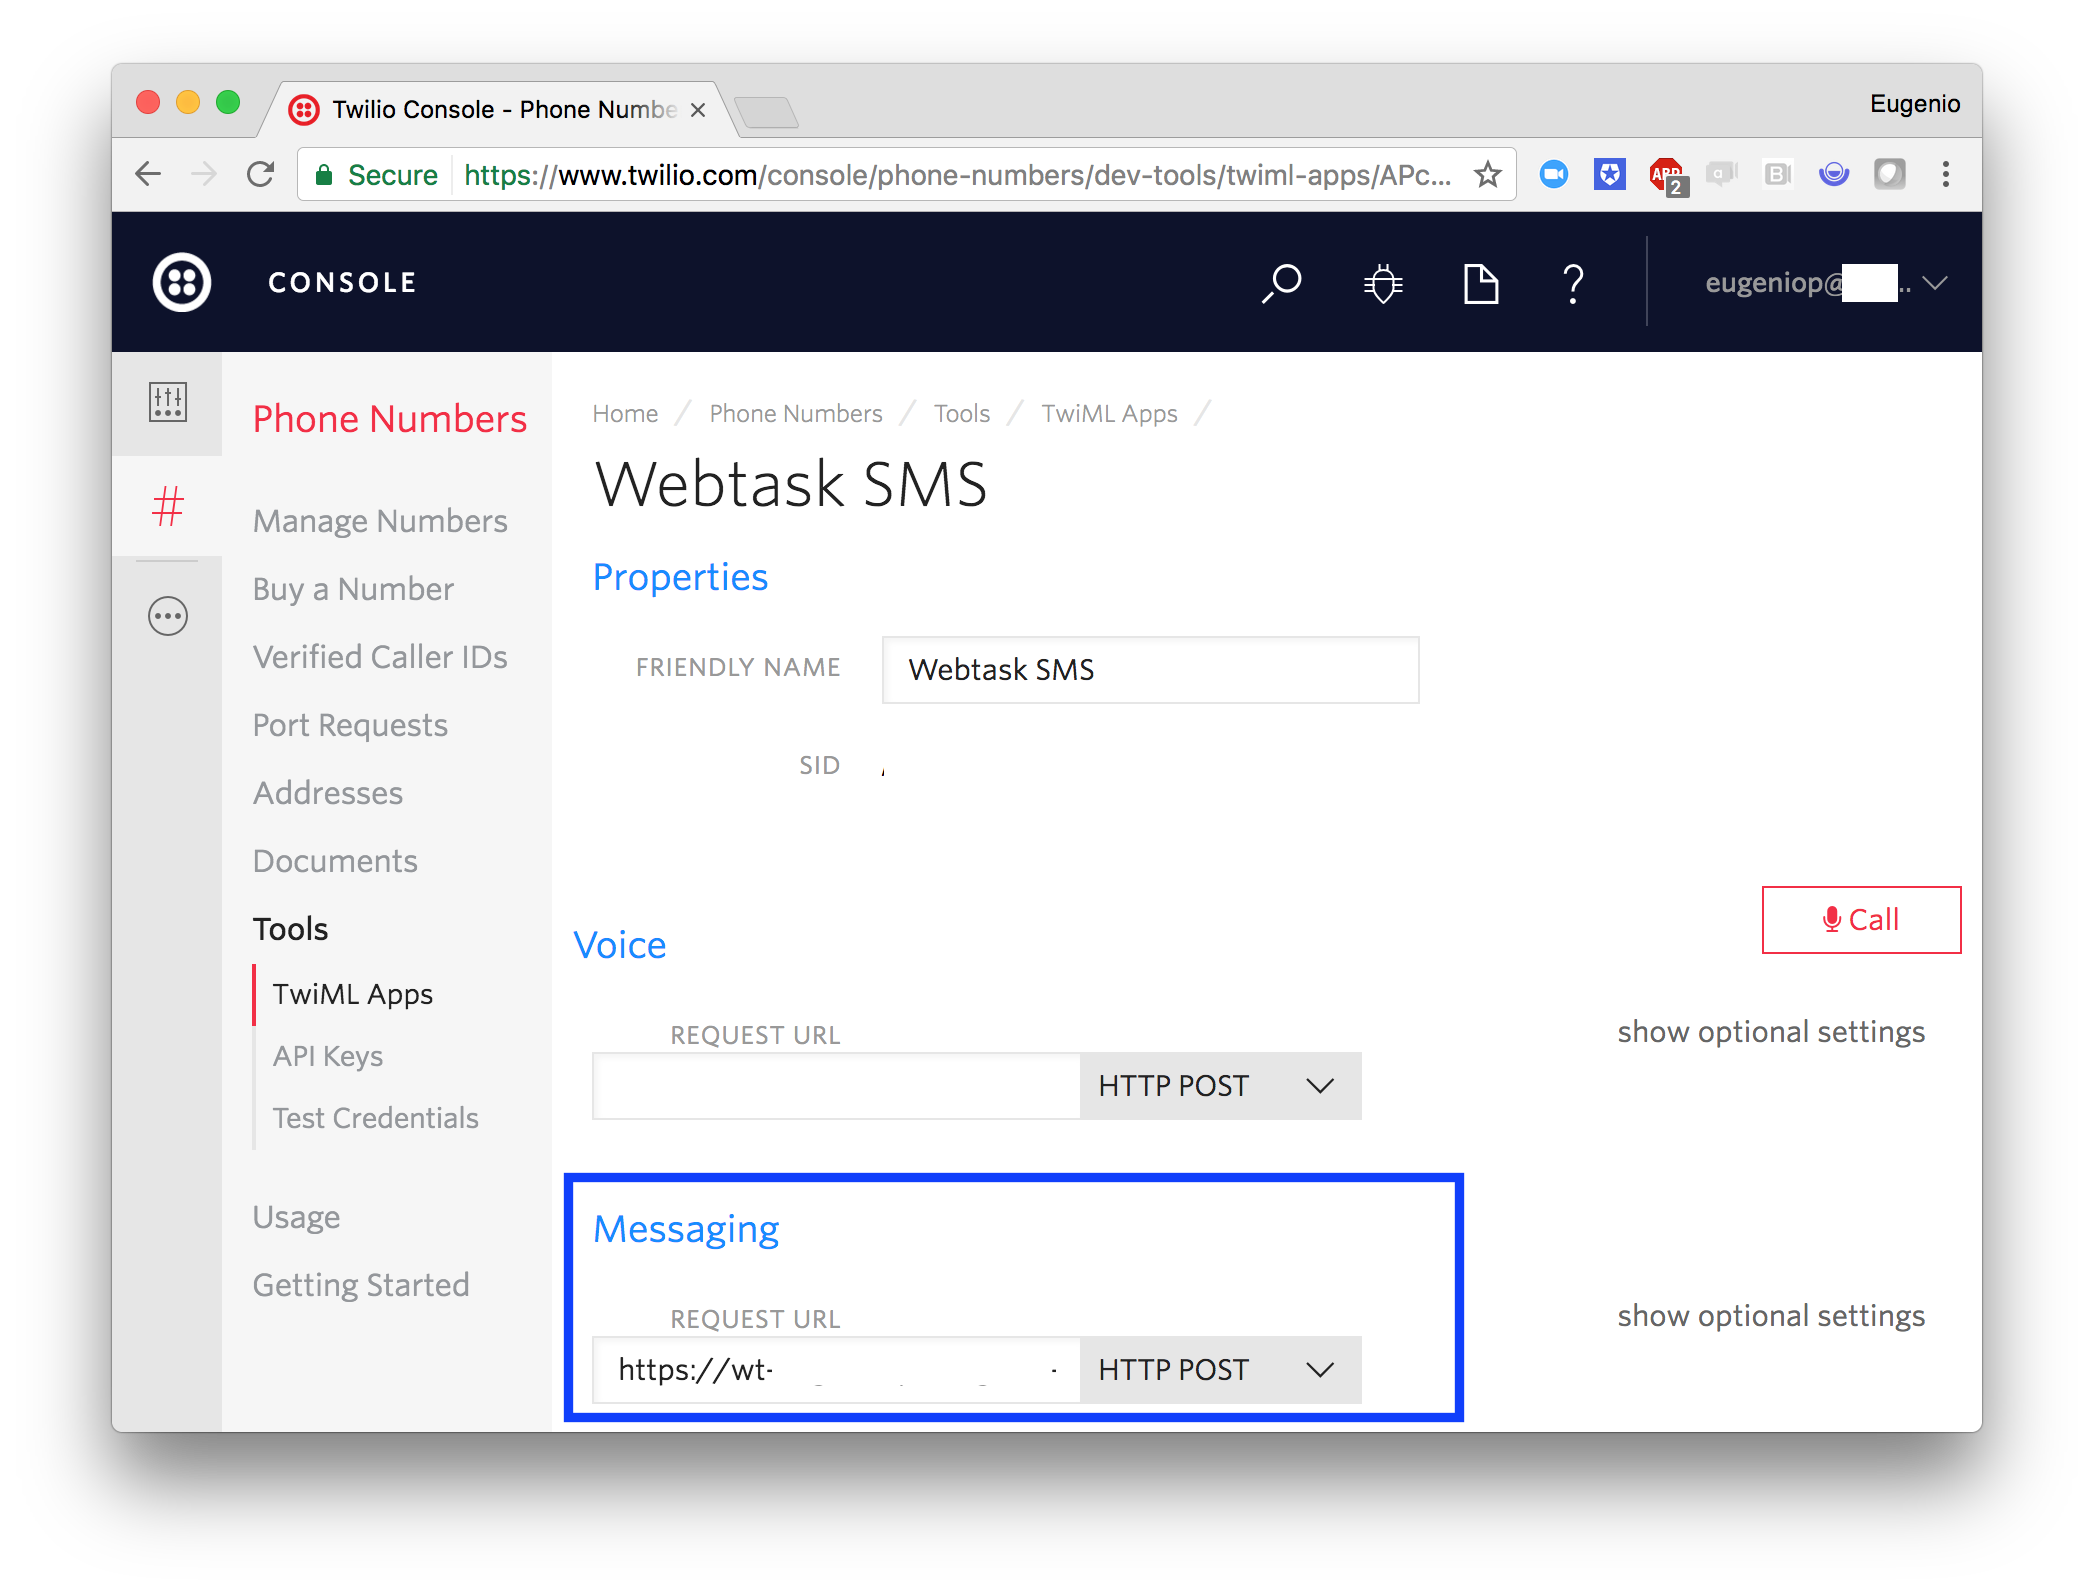
Twilio app
As before, the twilio SMS number is configured to call my webtask on the /sms endpoint:
This time I got a little bit fancier, and I built a very simple “menu” system that is a little bit more sophisticated. It starts with an array with an element per menu option:
var menu = [
    {
      name: "New sleep record",
      help: '"s {hours} {comment}" {hours} are total hours slept (decimals are OK: 5.5). {comment} is an optional note.',
      verbs:["s", "sleep", "sl"],
      handler: (done) => {
          saveSleep(MONGO_URL,phone,command,done);
      }
    },
    {
      name: "Mood",
      help: '"m {1-5} {comment}" {mood} from 1 to 5. 1:bad, 5:great. {comment} is an optional note.',
      verbs: ["m", "mood","md"],
      handler: (done) => {
          saveMood(MONGO_URL,phone,command,done);
      },
    },
];
verbsidentifies the command the system will recognize. In the example above, the first option in the menu isrecord new sleepands,sleepandslare all synonyms.Sleep for 7 hoursfor example, can be expressed ass 7orsleep 7.handleris the function to call when the command is identified.helpis well…a help text.
Now I can have a couple generic functions that work on the menu, and allows me to quickly add new commands easily.
function findMenuEntry(menu,verb){
  var menuEntry = _.find(menu,(m)=>{
                        return m.verbs.indexOf(verb)>-1
                     });
  if(!menuEntry){
    menuEntry = {
      handler: (done) =>{
        done(new Error("Invalid commmand"), util.format("Command not recognized [%s]\n%s", verb, "For help, send 'h' command."));
      }
    };
  }

  return menuEntry;
}
Notice the function returns a dummy entry if no entry is found. This simplifies the main function logic.
/*------------ Twilio App Main ---------------*/
server.post('/sms', (req, res, next) => {

  if(twilio.validateExpressRequest(req,req.webtaskContext.data.TW_AUTH_TOKEN, {protocol: 'https'}) === false){
     return next('Unauthorized. Only accepts requests from Twilio.');
  }

  const { MONGO_URL } = req.webtaskContext.data;

  //Commands on SMS are of the format: {c} {args}
  var { verb, command } = parseInput(req);
  var phone = req.body.From;

  var menu = [
    {
      name: 'New sleep record',
      help:
        '"s {hours} {comment}" {hours} are total hours slept (decimals are OK: 5.5). {comment} is an optional note.',
      verbs: ['s', 'sleep', 'sl'],
      handler: done => {
        saveSleep(MONGO_URL, phone, command, done);
      },
    },
    {
      name: 'Mood',
      help:
        '"m {1-5} {comment}" {mood} from 1 to 5. 1:bad, 5:great. {comment} is an optional note.',
      verbs: ['m', 'mood', 'md'],
      handler: done => {
        saveMood(MONGO_URL, phone, command, done);
      },
    },
    {
      name: 'Help',
      help: 'Get help on command. e.g. "h mood"',
      verbs: ['h', 'help'],
      handler: done => {
        //help
        if (!command) {
          return done(null, buildHelp(menu));
        }
        var menuEntry = findMenuEntry(menu, command);
        if (menuEntry) {
          done(null, menuEntry.help);
        } else {
          done(
            null,
            util.format(
              'Invalid command: [%s]\nAvailable commands:\n%s',
              command,
              buildHelp(menu)
            )
          );
        }
      },
    }
  ];

  var menuEntry = findMenuEntry(menu, verb);
  menuEntry.handler((e, msg) => {
    if (e) {
      msg = util.format('ERROR: %s', msg);
    }
    sendSMSResponse(res, msg);
  });
});
The help command builds automatically too:
function buildHelp(menu){
  return _.map(menu,(m)=>{return m.verbs[0]+" : "+m.name}).join('\n');
}
I love
lodash:-)
With this in place, I can add new commands very easily. But I think I’ve mentioned that already, haven’t I?
Securing your Twilio endpoint
This is easy, I’m using the same approach of checking the Twilio header X-Twilio-Signature (using the helper library):
...
if(twilio.validateExpressRequest(req,req.webtaskContext.data.TW_AUTH_TOKEN, {protocol: 'https'}) === false){
  return next('Unauthorized. Only accepts requests from Twilio.');
}
...
This prevents anyone from calling the sms endpoint, except Twilio itself. As they are the only ones that can generate the signature in the header.
The API & Website
Using express with Webtask is straight-forward with the use of the Webtask-tools module. This wires up Express with the main WT runtime:
import Webtask from 'webtask-tools';
const server = express();
...
module.exports = Webtask.fromExpress(server);
API endpoints look very familiar and easy to implement, and it follows REST-ish principles:
The purists among you would likely point out how this is not really even REST-ish. I get it.
server.get('/subscribers',auth,(req,res,next)=>{
    const { MONGO_URL } = req.webtaskContext.data;
    getSubscribers(MONGO_URL,{},(err,subscribers) => {
      if(err) return next(err);
      res.json(subscribers);
  });
});


server.get('/data/:phone/summary/:days?',auth,(req,res,next) => {

  const { MONGO_URL } = req.webtaskContext.data;
  const phone = req.params.phone;

  var days = getDays(req.params.days); //max is 120

  getSummary(MONGO_URL, phone, days, (err, summary) => {
    if (err) {
      return next(err);
    }
    summary.trendReportUrl = util.format(
      'https://%s/tracker/reports/trend/%s/%d',
      req.hostname,
      phone,
      days
    );
    summary.correlationReportUrl = util.format(
      'https://%s/tracker/reports/correlation/%s/%d',
      req.hostname,
      phone,
      days
    );
    res.json(summary);
  });
});
A more sophisticated API would likely benefit from more specialized frameworks, but Express is so simple that here it works great.
Securing the API
To secure the API I’m defining the resource in Auth0, and configured a middleware (auth) that simply validates the presence of a valid access_token. Regular stuff, nothing fancy.
Fun with Stats
Now that we have data, it is time to extract some insights from the stream of events. The app is designed so you capture a stream of mutliple events throughout the day. For example:
- When you wake up:
S 8 woke up onceandm 5 feeling great - You drive a brutal commute:
m 3 long commute - You had lunch with an old friend:
m 4 reconnected with friend - Your kid is sick, you pick him up frm school:
m 2 billy is sick - You go back to sleep:
m 4 watched a great movie after putting billy to bed
In this hypothetical day, you slept 8 hours and mood ranged from 2-5, with an average of 3.6. I was also interested in finding any correlations between mood and sleep so I needed a way of analyzing the stream.
All this is performed by the getSummary function, that will return an object like this (called with a 5 day window):
{
  "mood":{
    "min":2.5,
    "max":3.5,
    "avg":3.22,
    "median":3.5,
    "samples":9,
    "moodAvgByLocalTimeDay":[3.25,3.33,3.5,2.5,3]
  },
  "sleep":{
    "min":6,
    "max":8,
    "avg":7,
    "median":7,
    "samples":5,
    "sleepAvgByLocalTimeDay":[6.5,7.5,8,6,7]
  },
  "correlation":{
    "r2":0.72,
    "linear_regression":{
        "m":0.41600000000000364,
        "b":0.20399999999997442}
  },
  "trendReportUrl":"https://{BASE_WT_URL}.webtask.io/tracker/reports/trend/+12342341234/5",
  "correlationReportUrl":"https://{BASE_WT_URL}.run.webtask.io/tracker/reports/correlation/+12342341234/5"
}
Most properties are self-descriptive. But here are a few highlights in this example:
- The
moodAvgByLocalTimeDayis an array ofaveragemood for each day, in the users’ TZ. sleepAvgByLocalTimeDayis correspondent with themoodAvgByLocalTimeDay. Meaning that the values correspond to each day.- The
correlationobject describes the linear regression parameters for the values in the arrays.r2is the coefficient of determination and measures the degree ofcorrelationbetween the 2 sets: a value of 1 means “perfect” linear relationship between the 2 series.mandbare the parameters of the line for the correlation (y = m.x + b) - The last 2 properties are convenient links to the generated HTML reports.
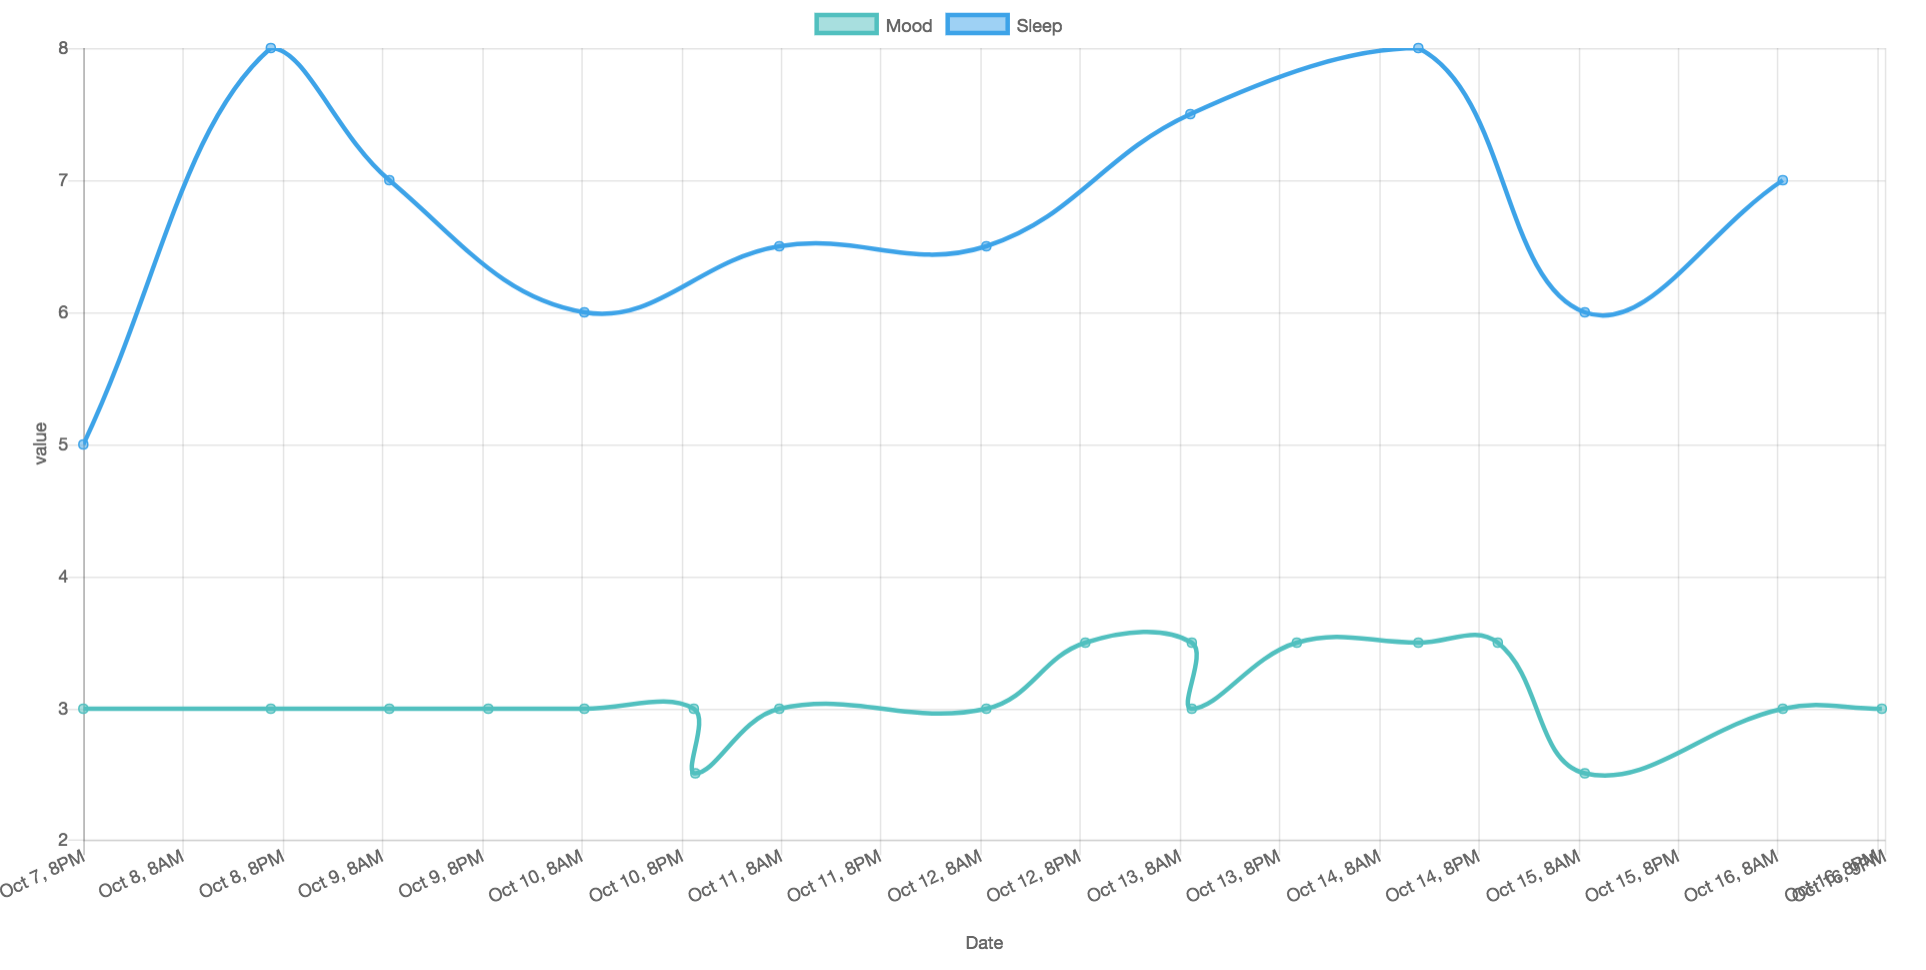
I use these values to render a couple of simple plots on HTML (using the awesome Chart.js):
Historical data
Correlation
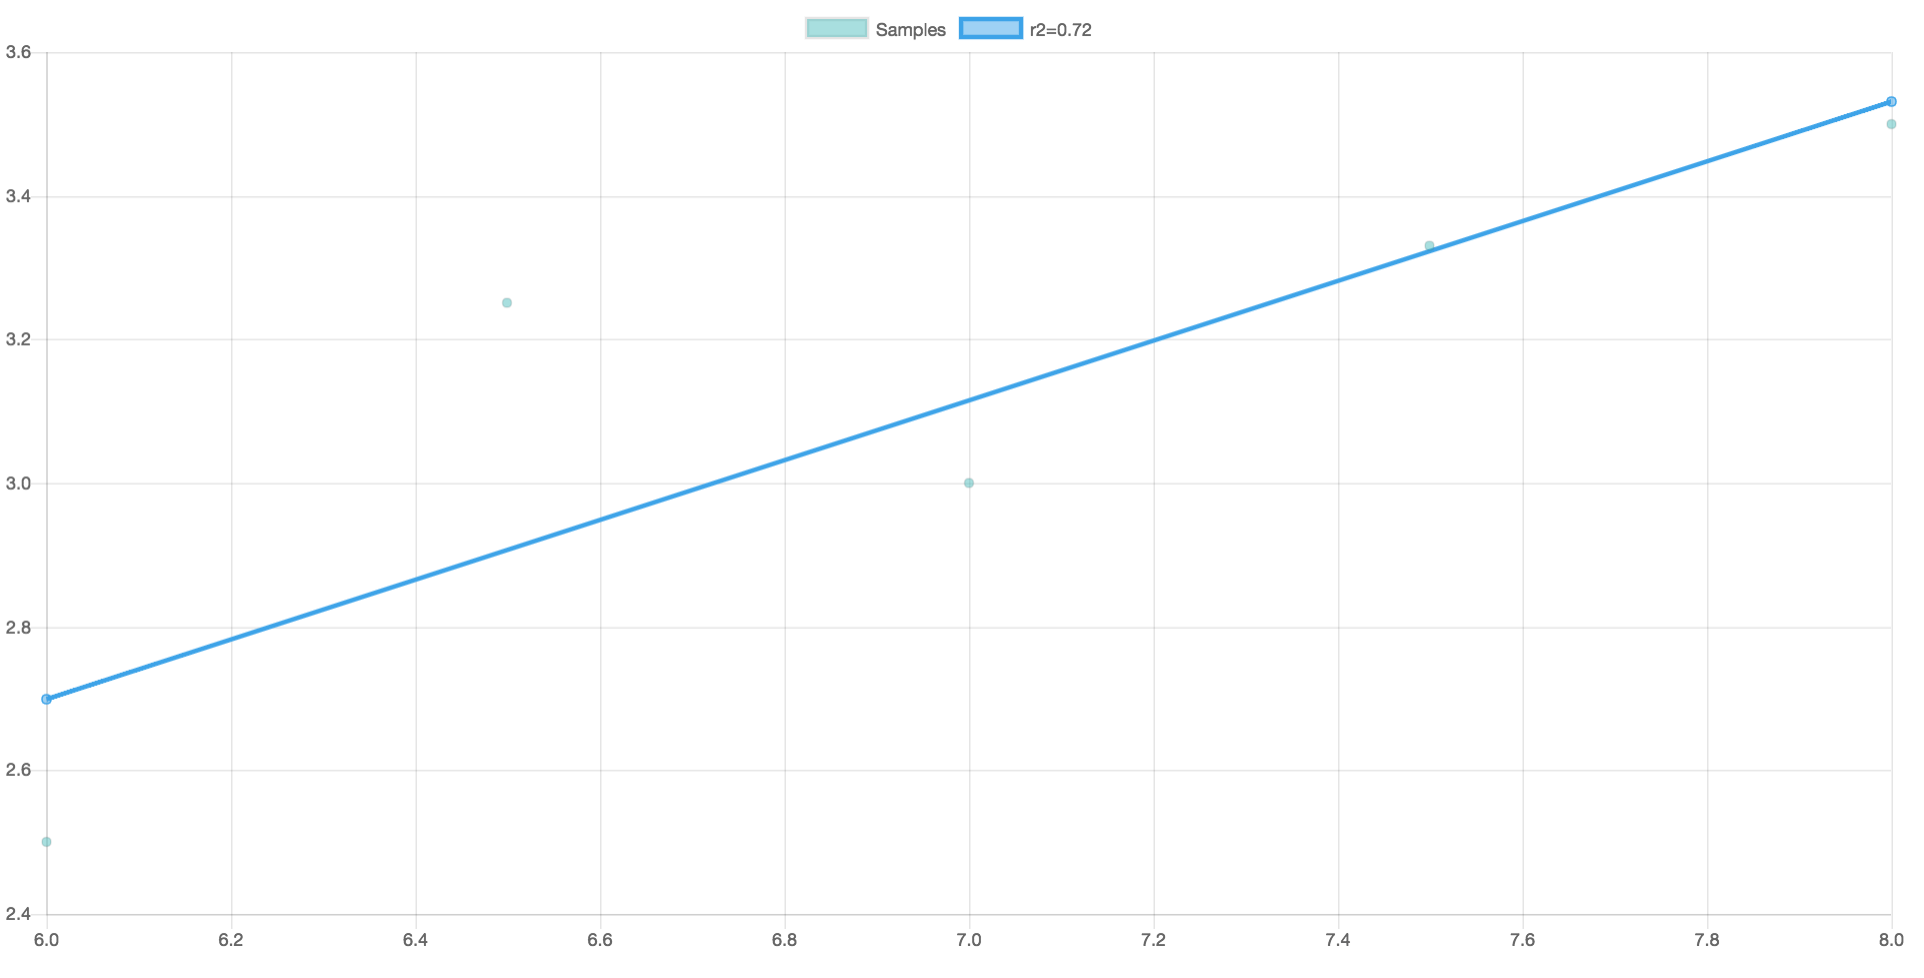
These are fake of course. I always sleep very well :-). More on these charts below.
Generating the summary data
Here’s my “getSummary” function:
/*
  mongo: mongo connections string
  phone: phone to look events for
  days: window of events to look for (the system will cap it at 120 days)
*/
function getSummary(mongo, phone, days, done) {

  getSubscribers(mongo, { phone: phone }, (err, subscribers) => {

    if(err){ return done(err); }
    if(subscribers.length === 0){ return done(new Error("Subscriber not found")); }

    //Defaulted to
    var tz = 'America/Los_Angeles';

    if(subscribers[0].tz) {
      tz = subscribers[0].tz;
    }

    getData(
      mongo,
      {
        phone: phone,
        createdAt: {
          $gte: new Date(new Date().getTime() - days * 24 * 60 * 60 * 1000),
        },
      },
      (err, data) => {
        if (err) {
          return done(err);
        }

        //No data, no errors, returns empty object
        if(data.length === 0) {
          return done(null, {});
        }

        //Group events by type (mood and sleep)
        var events = _.groupBy(data, (i)=>i.event);

        var sleep = events.sleep;
        var mood = events.mood;

        //Get hours & mood arrays from events
        var sleep_hours = _.map(sleep, (m)=>m.hours);
        var mood_mood = _.map(mood, (m)=>m.mood)

        var ss = require('simple-statistics@4.1.1');

        var stats = {
          mood: {
            min: ss.min(mood_mood),
            max: ss.max(mood_mood),
            avg: ss.mean(mood_mood),
            median: ss.median(mood_mood),
            samples: mood.length,
          },
          sleep: {
            min: ss.min(sleep_hours),
            max: ss.max(sleep_hours),
            avg: ss.mean(sleep_hours),
            median: ss.median(sleep_hours),
            samples: sleep.length,
          },
        };

        //Group events by Day (adjusted for TZ)
        var sleepByDay = _.groupBy(sleep, (i) => moment(i.createdAt)
                                                      .tz(tz)
                                                      .format('M-D'));

        var moodByDay = _.groupBy(mood, (i) => moment(i.createdAt)
                                                    .tz(tz)
                                                    .format('M-D'));

        //Find days with BOTH mood and sleep
        var daysWithBothSleepAndMood = _.intersection(_.map(sleepByDay,(i,k)=>k),_.map(moodByDay,(i,k)=>k));

        var sleepAvgByDay={};

        _.forEach(sleepByDay, (s,k) => {
          var avg = ss.mean(_.map(s,(i)=>i.hours));
          sleepAvgByDay[k] = Math.round(avg * 100 / s.length) / 100
        });

        stats.sleep.sleepAvgByLocalTimeDay = _.map(daysWithBothSleepAndMood,(d)=>sleepAvgByDay[d]);

        var moodAvgByDay={};

        _.forEach(moodByDay, (s,k) => {
          var avg = ss.mean(_.map(s,(i)=>i.mood));
          moodAvgByDay[k] = Math.round(avg * 100 / s.length) / 100
        });

        stats.mood.moodAvgByLocalTimeDay = _.map(daysWithBothSleepAndMood,(d)=>moodAvgByDay[d]);;

        //Simple correlation
        var samples = _.zip(stats.sleep.sleepAvgByLocalTimeDay, stats.mood.moodAvgByLocalTimeDay);
        var lr = ss.linearRegression(samples);
        var interpolation_line = ss.linearRegressionLine(lr);
        var r2 =
          Math.round(ss.rSquared(samples, interpolation_line) * 100) / 100;

        stats.correlation = {
          r2: r2,
          linear_regression: lr,
        };

        done(null, stats);
      }
    );
  });
}
It is easier to visualize what this function does with a simple diagram:
- In the first stage, I obtain all events from the database (using the
daysparameter to filter the time window we are interested in) - Then I group events by
type. It is very simple then to obtain regular stats values from these 2 collections streams. A simple_.mapto extract the values from the events (e.g._.map(sleep,(s)=>s.hours)returns the array of hours in the sleep event stream) - Then I group again by day (adjusted for TZ), and I find the intersection between the 2 groups. In the example above, there are 5
sleepevents, but only 4mood. So the intersection will be the set{1,2,3,4}. This will be used for the correlation computations, where I need 2 arrays with corresponding values.
This method extensively uses the simple-statistics module that ships with a ton of very useful statistics functions.
Wait…what about performance?
As you can easily deduct from the code above, this implementation results on many iterations over the same datasets (e.g. all the mean, min, max, etc.). I guess I could compute all those values on a single pass over the stream, but…quite frankly, I’m not interested in optimizing performance at the moment. The app limits queries to just 120 days at most, which would result in ~500 events. This is a relatively small set in practice, and I’m the only user at the moment :-).
“Early optimization is the source of all evil”.
One area to explore, and that I’m curious to learn more about, is how much of this can be pushed to mongo. Mongo does have a “pipeline” with complex operations: aggregation, map/reduce, etc. but I have not fully explored. Will be added to the “todo”.
I do intend to measure a little bit and find out though. simple-statistics looks lean and well implemented, but somewhat rigorous for my humble needs.
Generating HTML reports
The trend report is simple HTML at the moment. I have not fully secured these pages, so I have disabled them. But I’m using a trick that Tomek taught me. I’m storing the entire App/API/web app in a single Webtask, so the HTML templates are embedded and rendered using ejs:
function chartForm() {
  /*
<!doctype html>
<html>
<head>
  <title>Sleep & Mood for <%-phone%></title>
  <script src="https://cdnjs.cloudflare.com/ajax/libs/moment.js/2.13.0/moment.min.js"></script>
  <script src="https://cdnjs.cloudflare.com/ajax/libs/Chart.js/2.6.0/Chart.bundle.min.js"></script>
  <style>
    canvas {
        -moz-user-select: none;
        -webkit-user-select: none;
        -ms-user-select: none;
    }
  </style>
</head>

<body>
  <div style="width:75%;">
    <canvas id="canvas"></canvas>
  </div>
  <br>
  <br>
  <script>
    var timeFormat = 'YYYY/MM/DD HH:mm:ss';
    var color = Chart.helpers.color;
    var blue = 'rgb(54, 162, 235)';
    var green = 'rgb(75, 192, 192)';

    var config = {
      type: 'line',
      data: {
        datasets: [
        {
          label: "Mood",
          backgroundColor: color(green).alpha(0.5).rgbString(),
          borderColor: green,
          fill: false,
          data: <%-JSON.stringify(data.mood)-%>,
        },
        {
          label: "Sleep",
          backgroundColor: color(blue).alpha(0.5).rgbString(),
          borderColor: blue,
          fill: false,
          data: <%-JSON.stringify(data.sleep)-%>,
        }]
      },
      options: {
        title:{
          text: "Last 30 days of Mood & Sleep"
        },
        tooltips: {
          callbacks: {
            afterFooter: function(items,data){
                            var i = items[0];
                            return data.datasets[i.datasetIndex].data[i.index].comment;
                          }
          }
        },
        scales: {
          xAxes: [{
            type: "time",
            time: {
              format: timeFormat,
              tooltipFormat: 'll HH:mm'
            },
            scaleLabel: {
              display: true,
              labelString: 'Date'
            }
          }, ],
          yAxes: [{
            scaleLabel: {
              display: true,
              labelString: 'value'
            }
          }]
        },
      }
    };

    window.onload = function() {
      var ctx = document.getElementById("canvas").getContext("2d");
      window.myLine = new Chart(ctx, config);
    };
  </script>
</body>
</html>
*/
}

function hereDoc(f) {
  return f
    .toString()
    .replace(/^[^\/]+\/\*!?/, '')
    .replace(/\*\/[^\/]+$/, '');
}
and then the function to render (shortened):
server.get('/reports/trend/:phone/:days?', (req, res, next) => {
  var phone = req.params.phone;
  var days = getDays(req.params.days);
  const { MONGO_URL } = req.webtaskContext.data;

  getSubscribers(MONGO_URL, { phone: phone }, (err, subscribers) => {
    var tz = 'America/Los_Angeles';

    if (subscribers.length > 0 && subscribers[0].tz) {
      tz = subscribers[0].tz;
    }

    getData(
      MONGO_URL,
      {
        phone: phone,
        createdAt: {
          $gte: new Date(new Date().getTime() - days * 24 * 60 * 60 * 1000),
        },
      },
      (err, data) => {
        if (err) return next(err);
        res.header('Content-Type', 'text/html');
        var dataset = {
          mood: [],
          sleep: [],
        };
        _.forEach(data, d => {
          var valueProperty = { sleep: 'hours', mood: 'mood' };
          dataset[d.event].push({
            x: moment(d.createdAt)
              .tz(tz)
              .format('YYYY/MM/DD HH:mm:ss'),
            y: d[valueProperty[d.event]],
            comment: d.comment || '',
          });
        });

        res.end(
          ejs.render(hereDoc(chartForm), {
            phone: phone,
            data: dataset,
          })
        );
      }
    );
  });
});
ToDo’s
- Work on some performance metrics for reporting
- Secure the HTML
- Learn how much of the data insights can be pushed to MongoDb